Membership
At the end of 2024–25, Sheep Genetics supported 1,035 active sheep flocks and 13 goat herds. Members participate through the LAMBPLAN, MERINOSELECT and KIDPLAN evaluations, which provide independent genetic information to support breeding and selection decisions. LAMBPLAN continues to be the largest evaluation, representing almost two-thirds of all participating flocks.
| Analysis | Count of flocks |
| LAMBPLAN | 664 |
| MERINOSELECT | 371 |
| KIDPLAN | 13 |
Figure 1. Breakdown by analysis
Australian member distribution
Sheep Genetics members are located throughout Australia, with the majority of flocks based in New South Wales and Victoria. Strong participation is also maintained across Western Australia and South Australia, with members contributing valuable performance data from a diverse range of production environments.
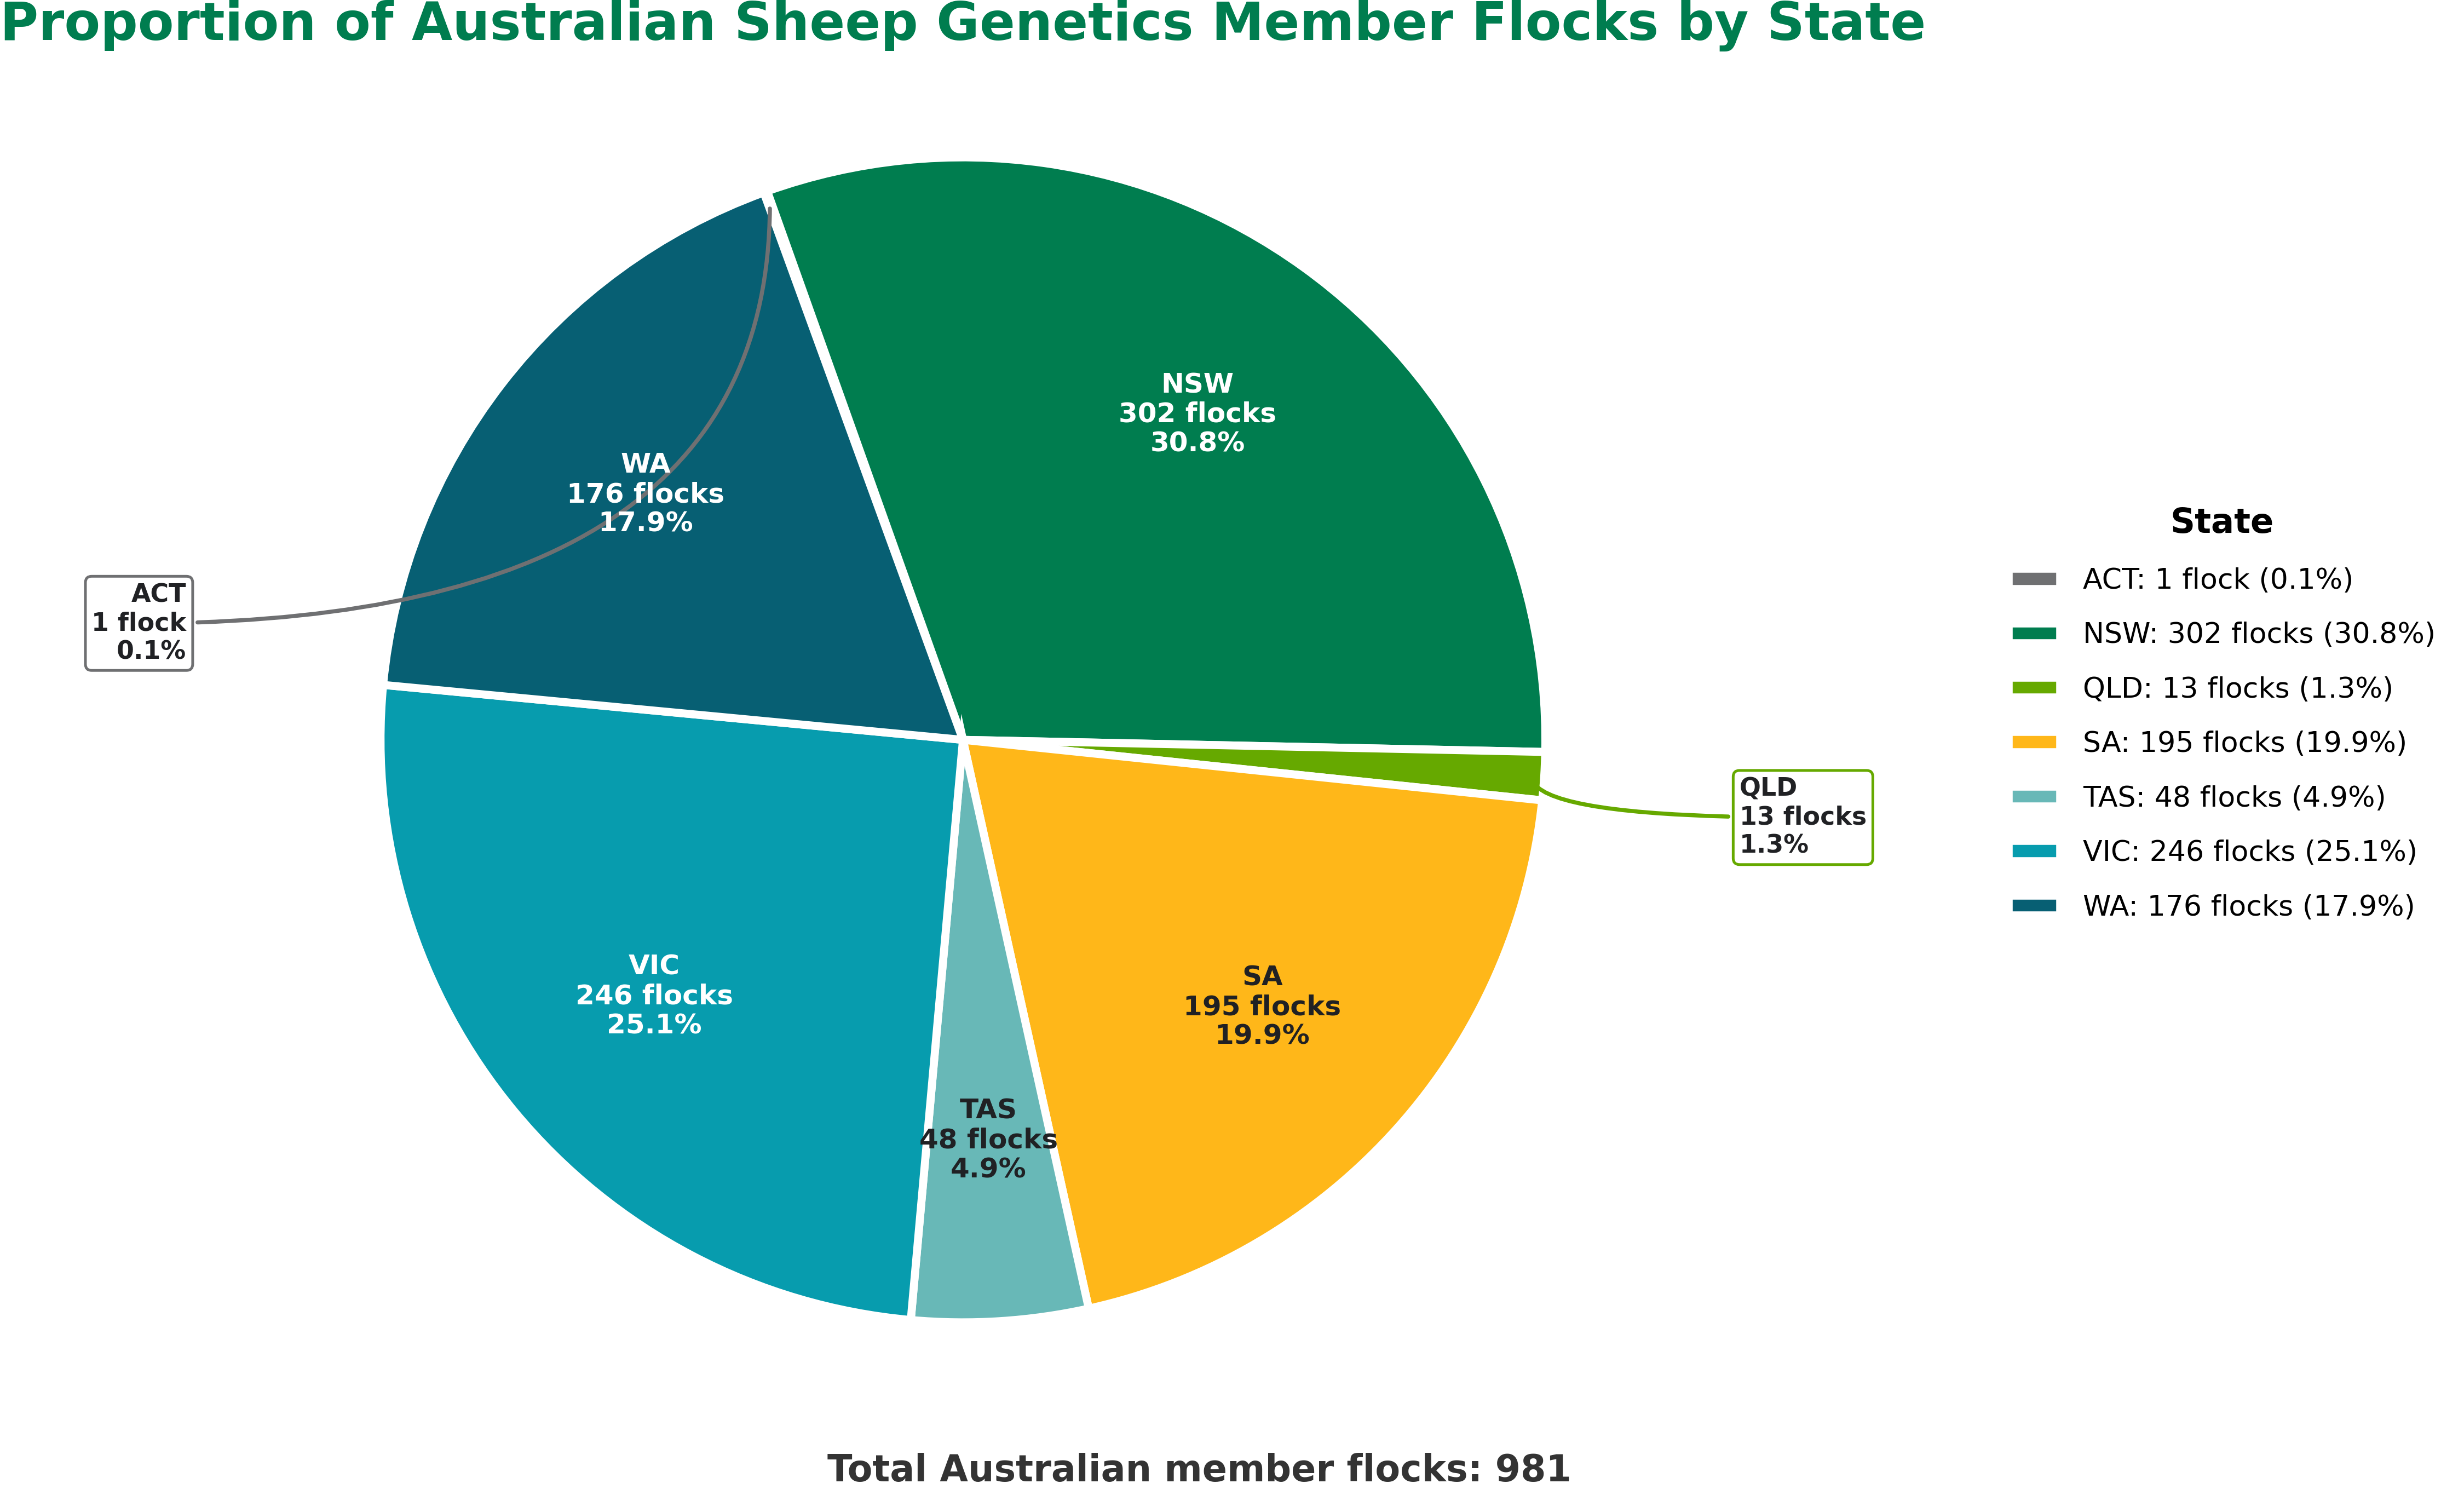
Figure 2. Proportion of Australian Sheep Genetics member flocks by state
International flocks
While the majority of Sheep Genetics members are based in Australia, several international flocks also participate in the evaluation. Members from New Zealand, South America and Asia contribute data and utilise Australian genetics, allowing their animals to remain genetically linked to Australian flocks. This connectivity enables direct comparison of genetic merit across countries and strengthens the international influence of Australian sheep genetics.
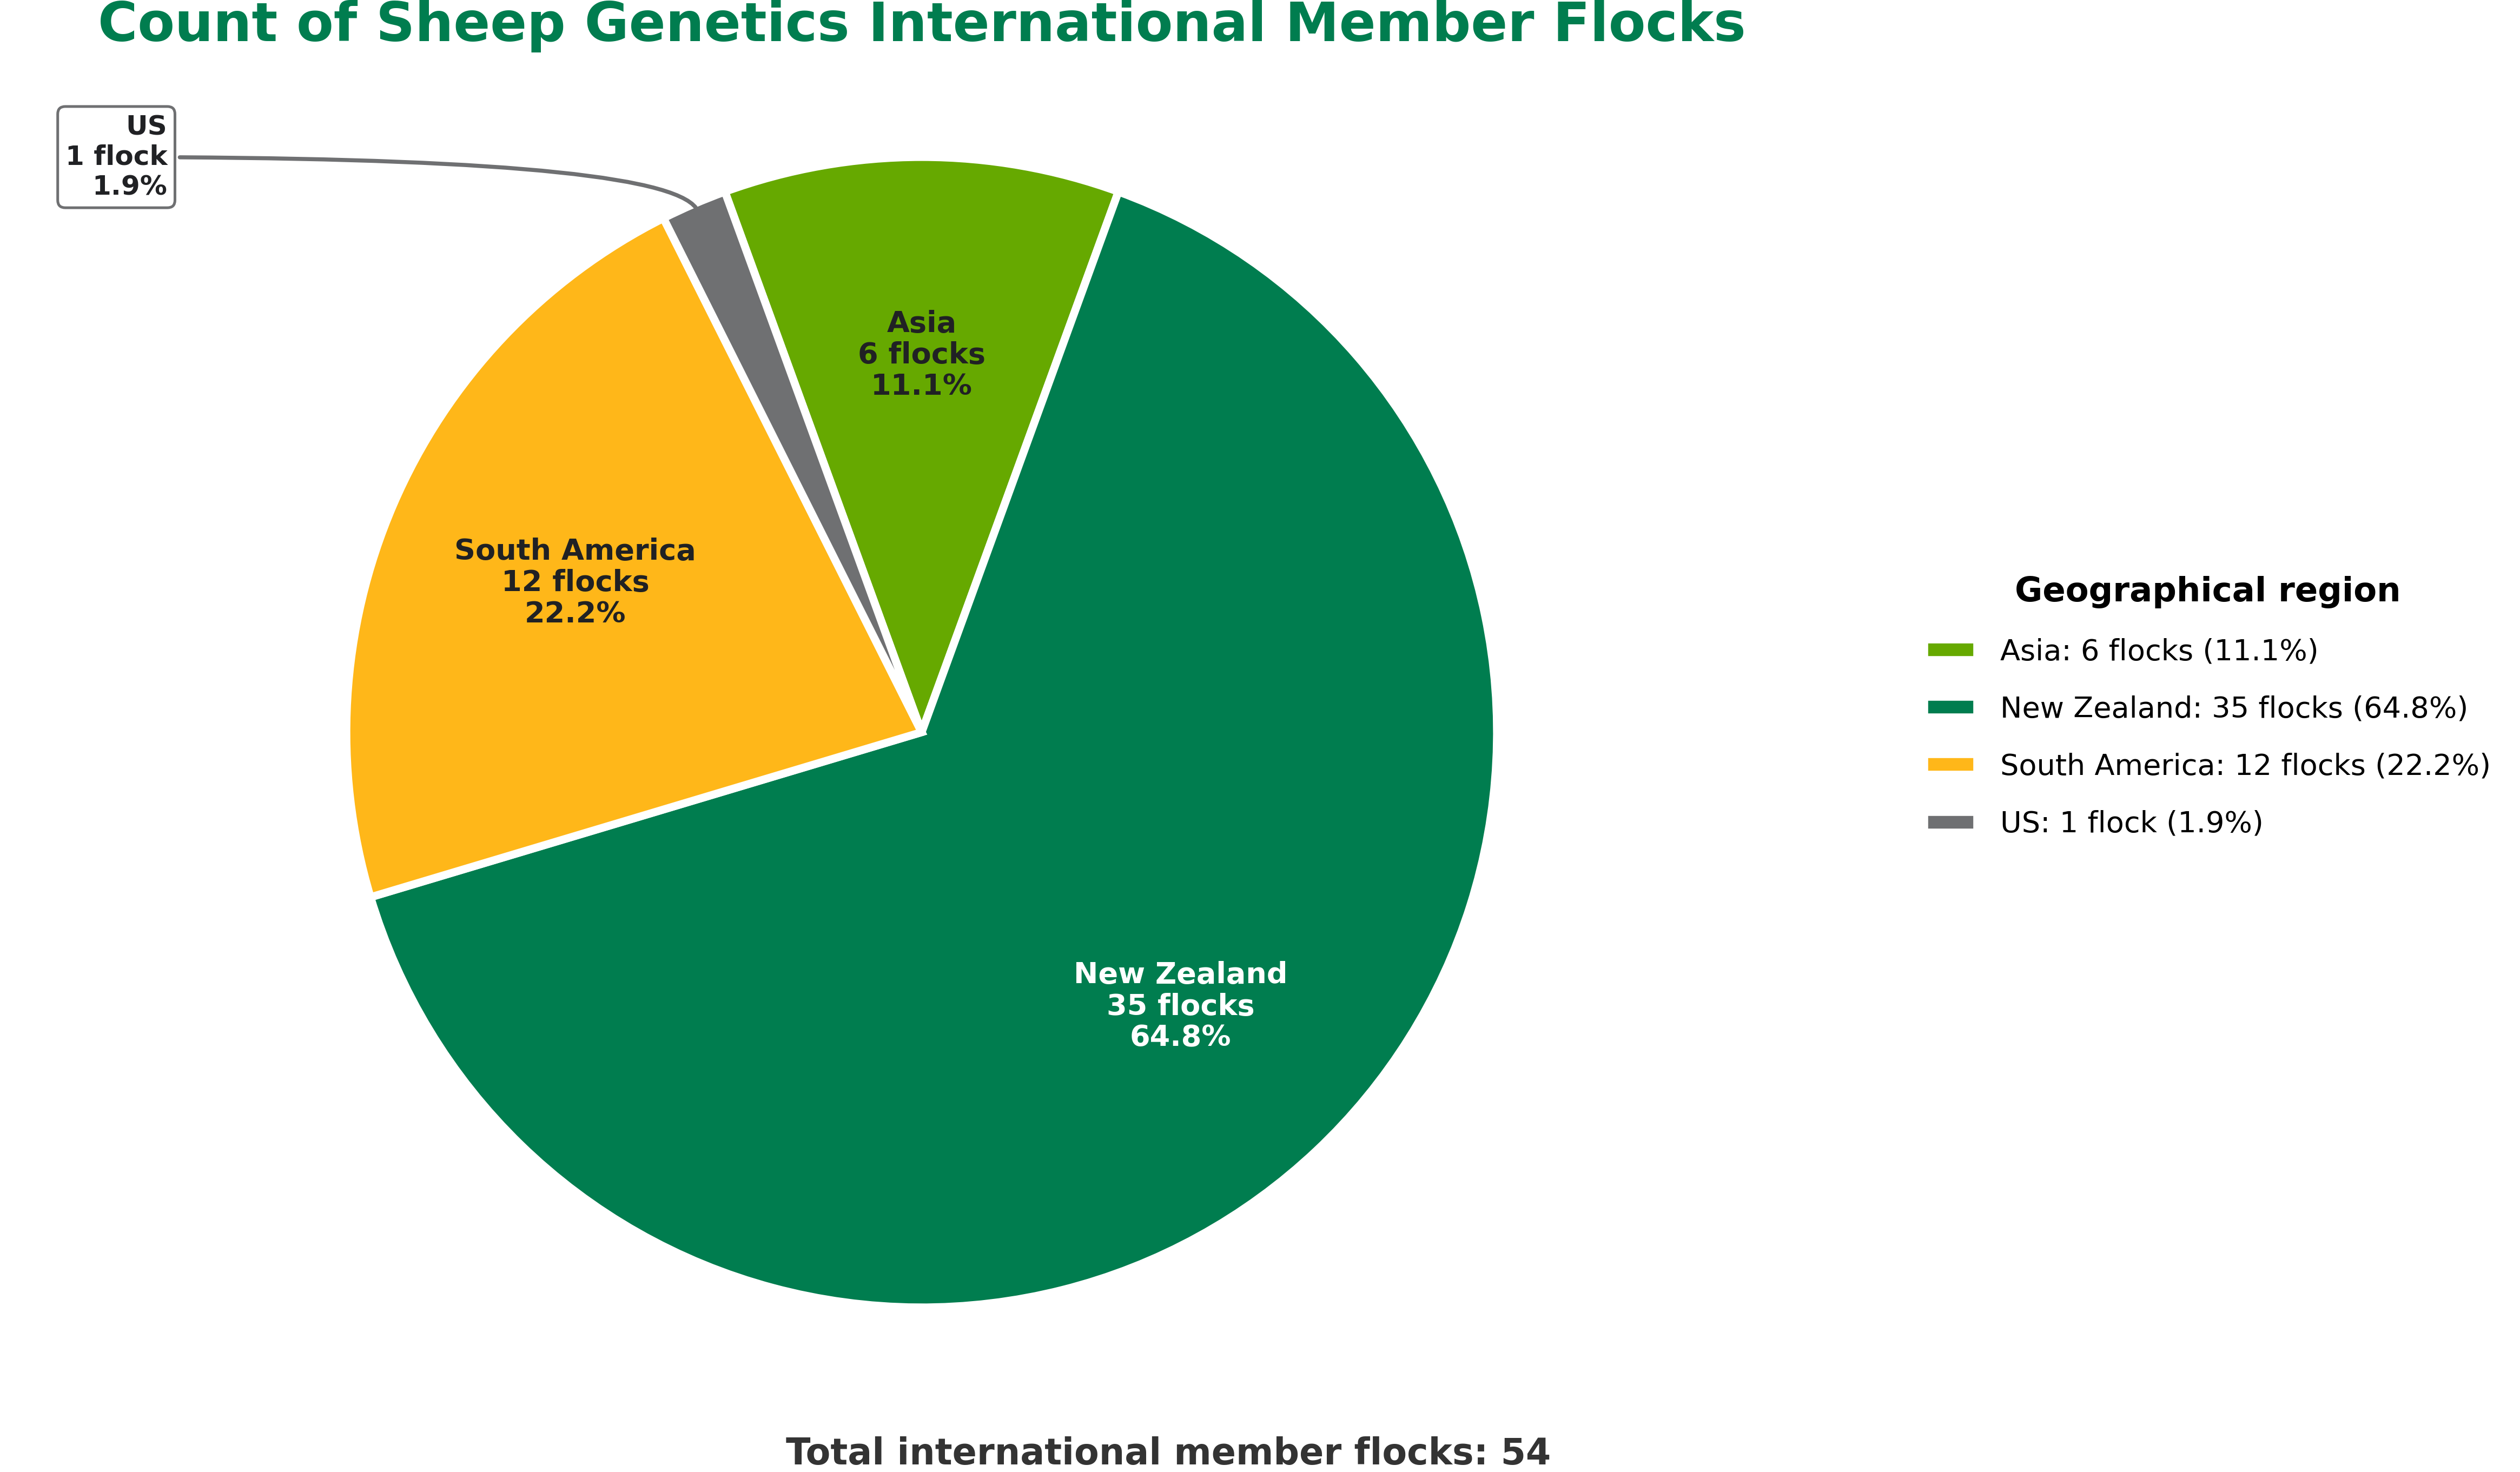
Figure 3. Count of Sheep Genetics international member flocks
National Sheep Improvement Program
Sheep Genetics continues to provide genetic evaluation services to the National Sheep Improvement Program (NSIP) in the United States. Through this partnership, Sheep Genetics delivers Estimated Breeding Values (EBVs) to participating American sheep producers, supporting genetic improvement and helping maintain genetic links with Australian genetics.
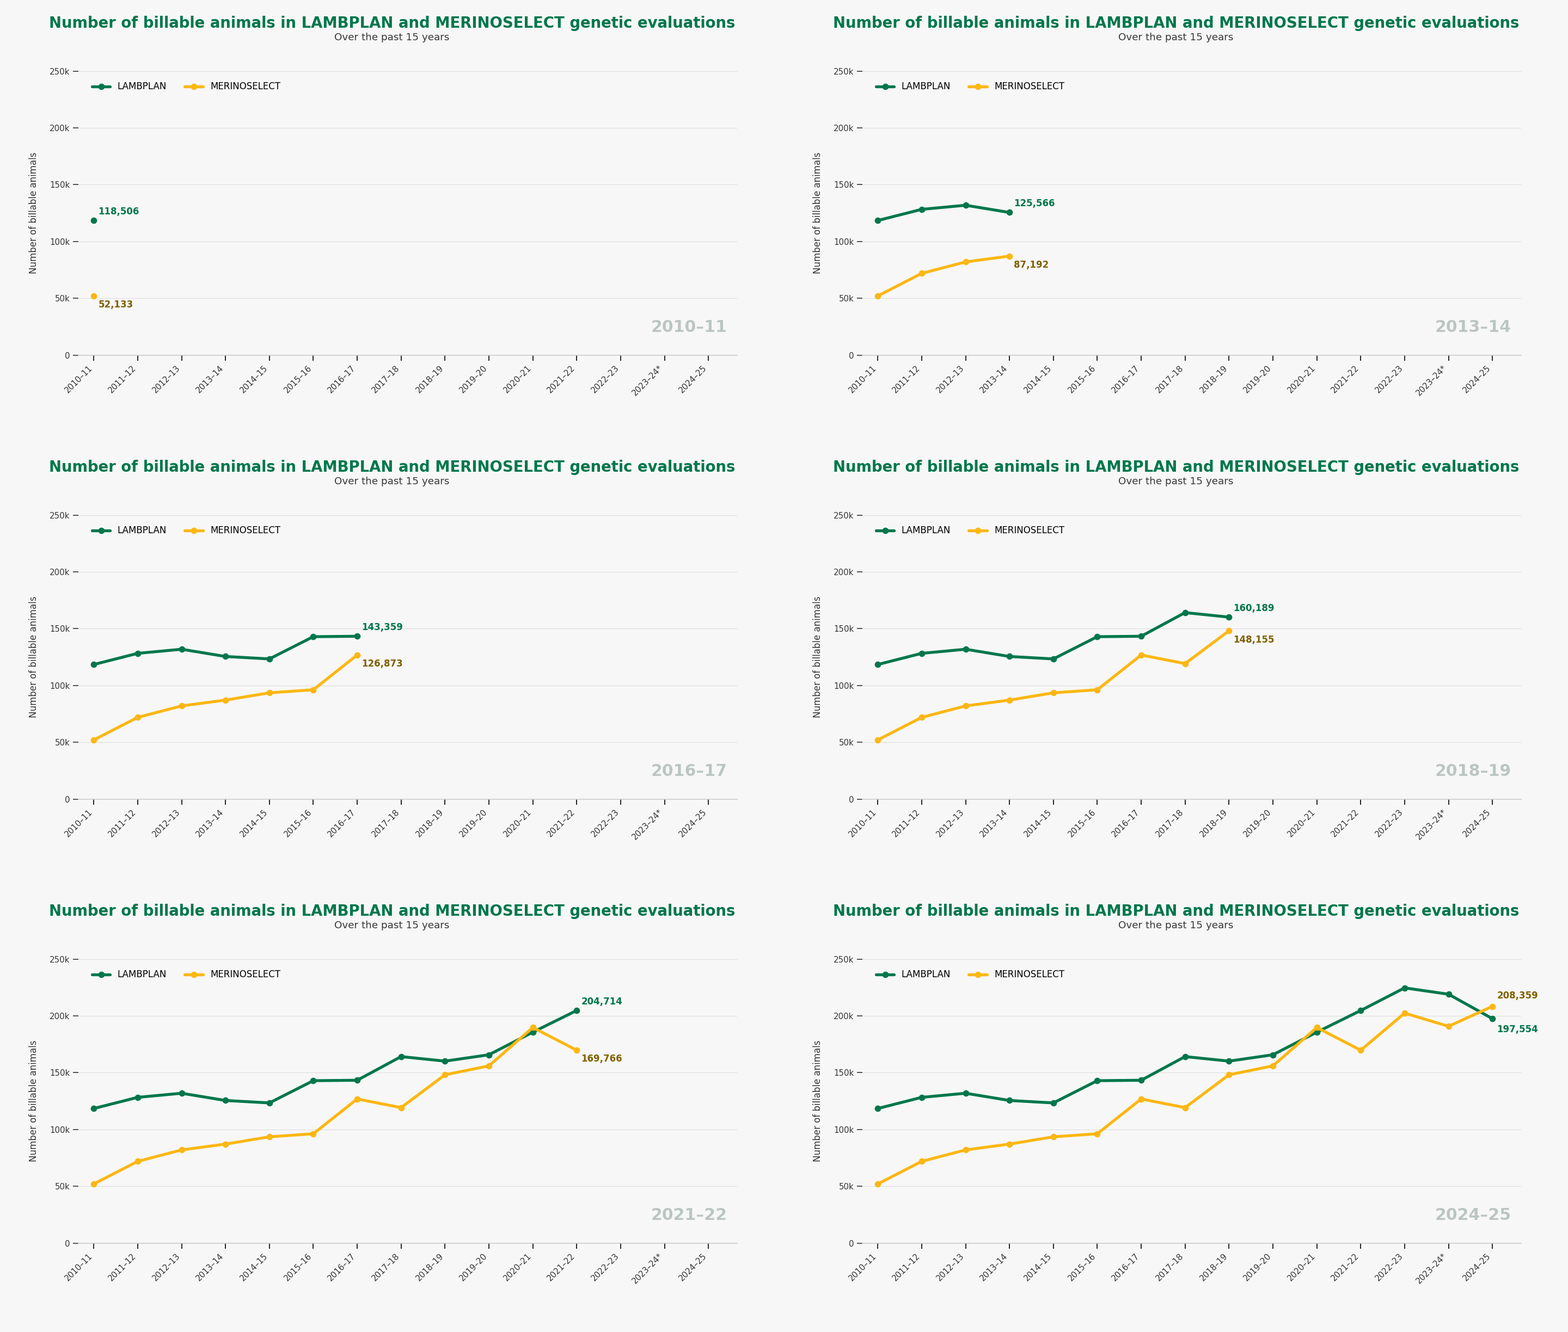
The continued growth in flock participation and billable animals demonstrates the ongoing value of this collaboration and the increasing adoption of objective genetic evaluation internationally.
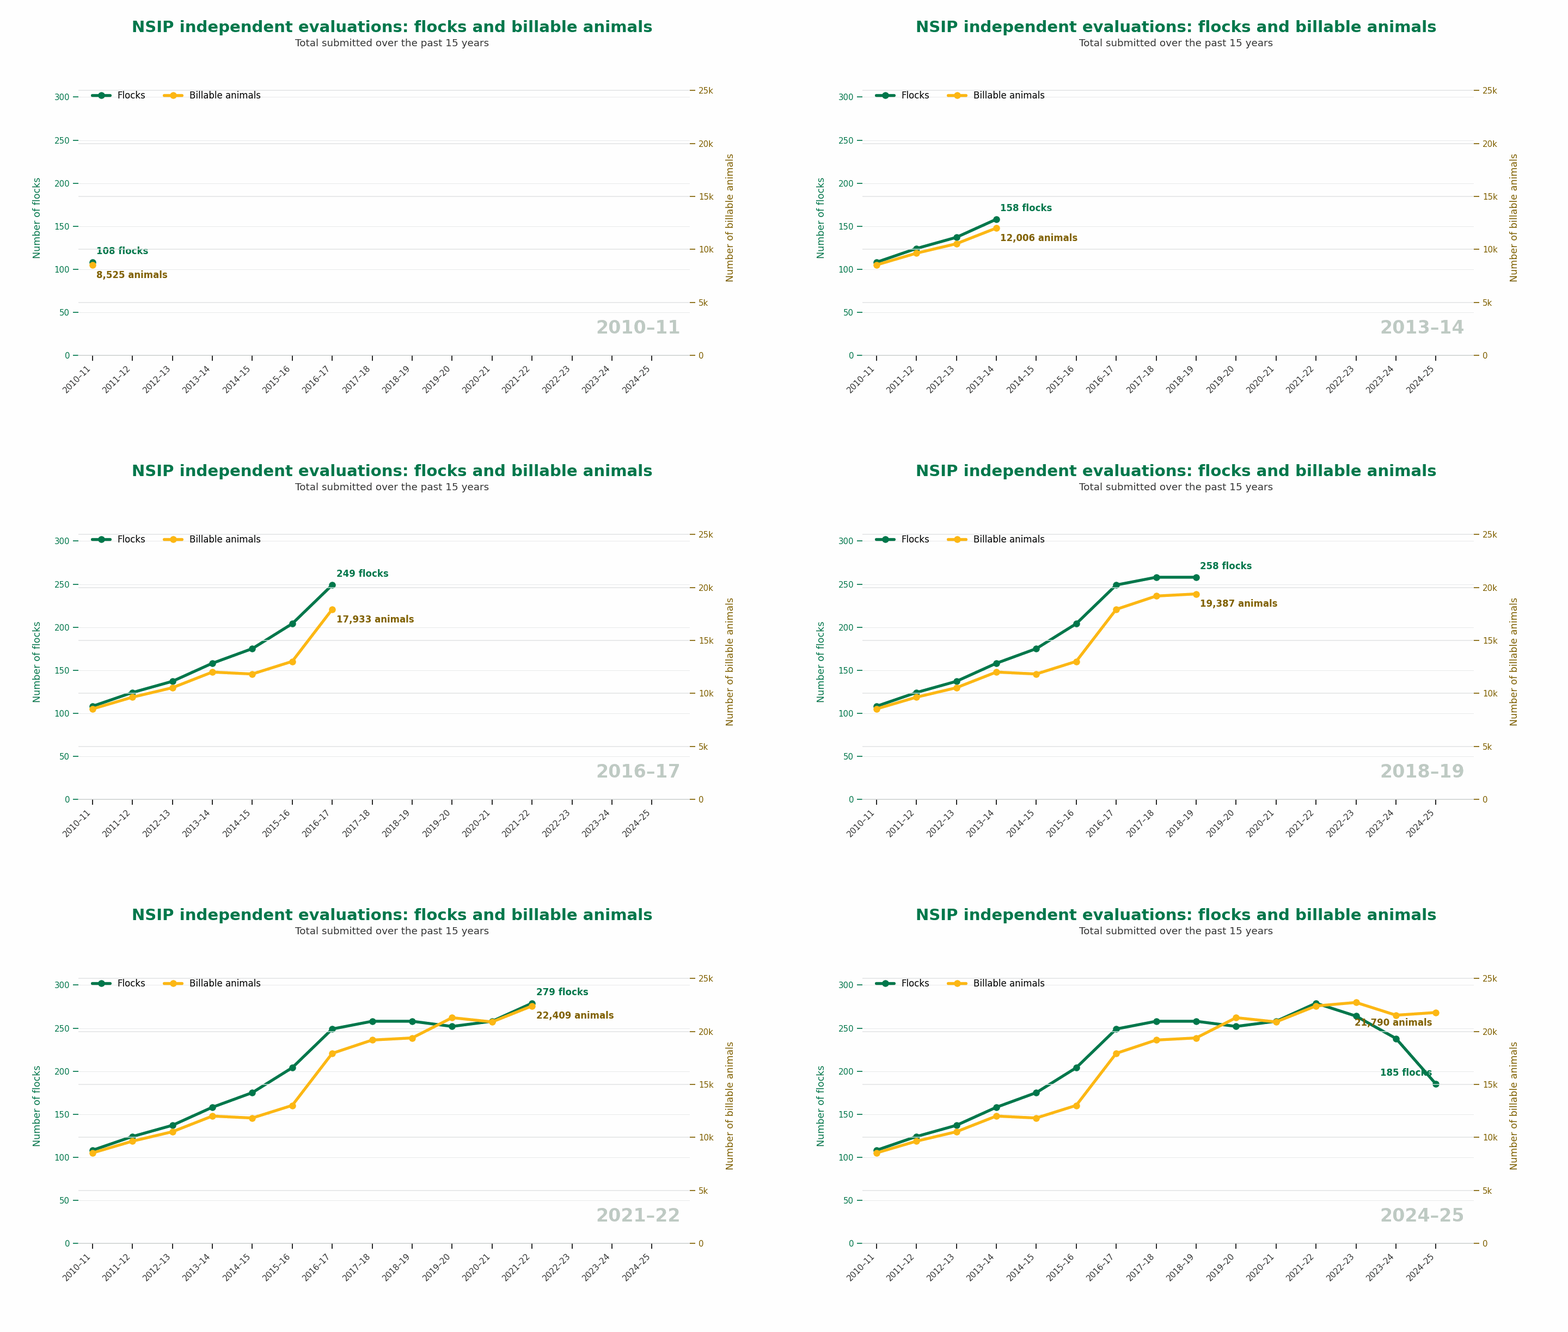
Figure 4. Total number of flocks and billable animals submitted via the NSIP independent evaluations in the past 15 years